📖 Afaqy Knowledge Base / AVL / Messages
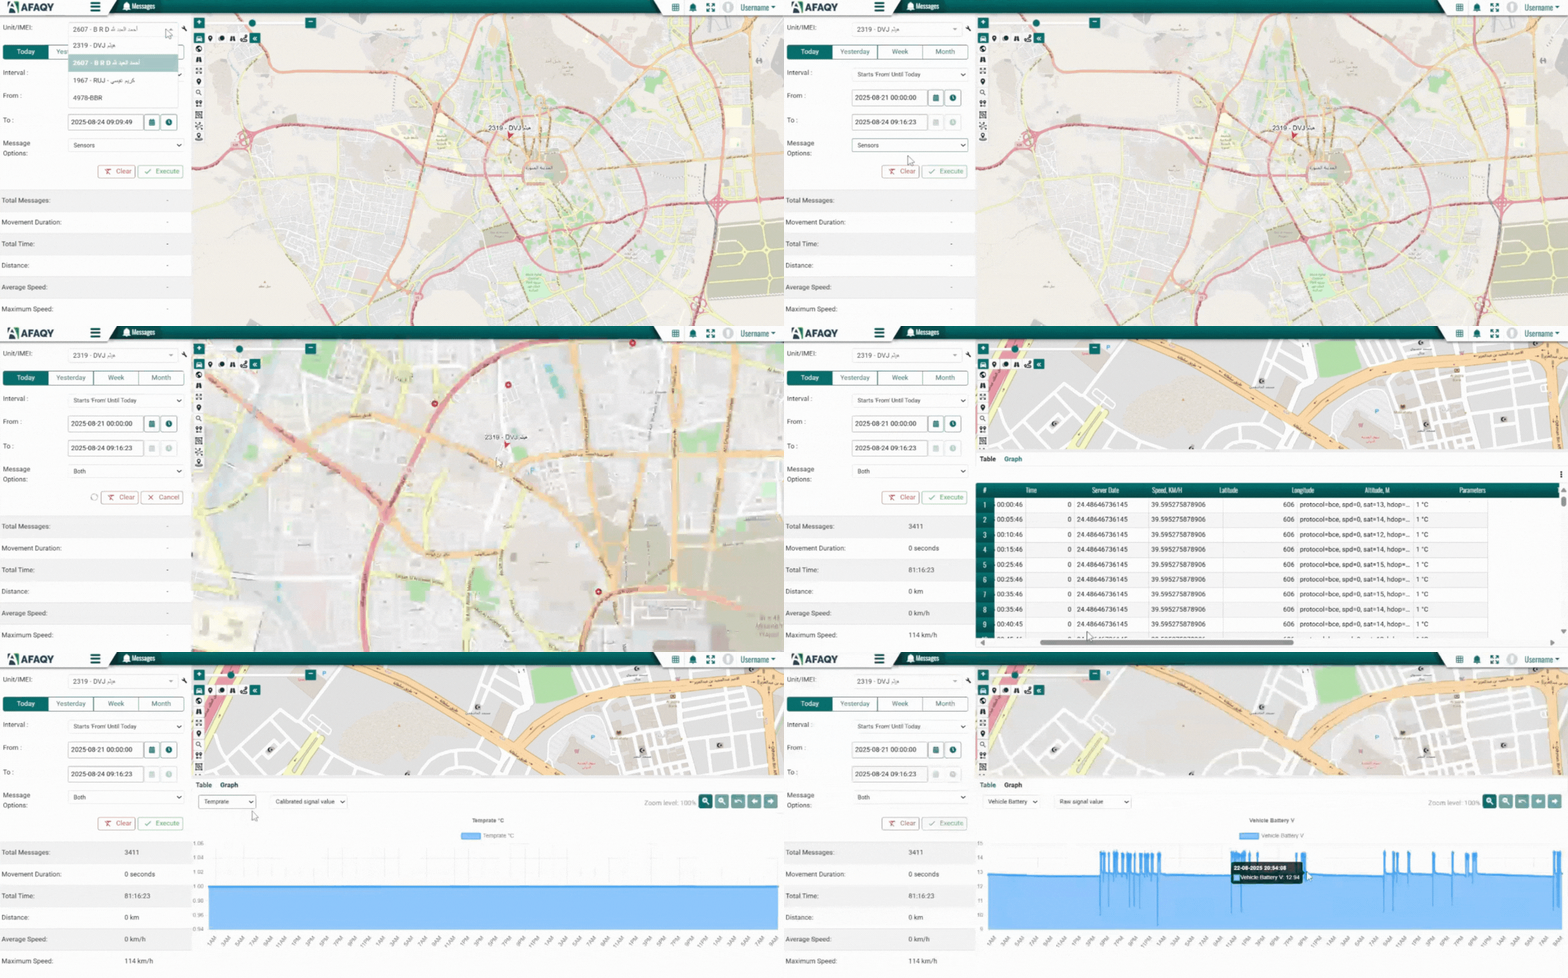
The Messages section gives you a raw, timestamped stream of every update a unit sends to AVL (parameters + sensors). Use it to diagnose connectivity, validate sensor behavior, and investigate incidents at the most granular level.

1
2
3
4
5
6 | Homepage Button
Select Unit
Current Section
Edit Unit Table Tab Graph Tab | 7
8
9
10
11
12 | User Apps Button Notifications Button
Full-Screen Button
Manage Account Button
Sub-User(s) List Map View Button | 13
14
15
16
17
18 | Monitoring / Total Stopping Units
Moving Units
Updates Button Time O'clock Customize Grid Columns |
Permissions
- Users must have view access to the selected unit(s).
- If units are shared via Shared Groups, users with View Only / Inherit can read messages for those units.
- Admins can query a single unit at a time, even within shared accounts, in accordance with the tenant setup permissions.
Tracing Messages
Follow these steps to trace messages for any unit:

- Select Unit(s)
- Use the Unit Search field.
- Search by Unit Name or IMEI.
- Only a single unit can be added at a time.
- Units shared via Shared Groups are visible if you have view permission.
- Choose Source
- Parameters: Raw device/sensor data (e.g., speed, position, voltage, ACC, RPM).
- Sensors: Values after sensor calibration (e.g., fuel level, temperature, weight).
- Both: merges parameters + sensors in one stream.
Tip: For fuel/temperature investigations, start with Sensors to declutter.
- Set Time Range
- Presets: Today, Yesterday, Last Week, Last Month.
- Or choose a Custom range (From / To).
- The To time cannot exceed the current time.
The maximum interval between the From and To dates is three months
- Run Query
- Click Execute to fetch messages.
- Click Cancel to stop a long-running query.
- Use Reset to clear all filters.
- Review Summary
- Duration: span of time covered.
- Distance: total route length.
- Average Speed.
- Maximum Speed.
- Explore Results
- Switch between Table View and Graph View using the toggle.
- Use Export to download results to Excel.
After execution, a summary strip appears below the mentioned input:
Table View
The Table View lists each message as a row with full details.

Columns
Displayed columns depend on unit profile and installed sensors. Common fields include:
- Timestamps: Device Time, Server Time
- Location: Latitude, Longitude, Address, Altitude
- Movement: Speed, Motion/ACC, RPM
- Sensors: Fuel level, Temperature(s), Weight/Axle load
- Electrical: Main/Backup Voltage, Satellites, Accuracy
No assignments displayed in messages table
Graph View
The Graph View visualizes selected parameters over time.
.gif?w=828.734375)
Controls
- Parameter Selector → choose series (Speed, Fuel, Temp, Voltage, RPM, etc.).
- Legend Toggles → show/hide series.
- Zoom & Pan → drag to zoom into a window, reset to fit all data.
- Tooltip & Crosshair → hover to see exact timestamp + value.
- Row Sync (if enabled) → click a graph point to highlight corresponding table row.
Usage
- Plot Fuel Level + Speed → spot fuel drops while stationary.
- Plot Temperature + Door → detect cold-chain breaches.
- Plot Speed + Satellites → validate GPS accuracy.
Common Tasks
A) Check if a vehicle stopped sending data
- Source = Both → Unit = target vehicle → Time = Today (last 2–4h) → Execute
- Confirm timestamp gaps in Table; verify Voltages/ACC for power issues.
- If there’s a gap: check SIM/connectivity/device power.
B) Investigate a fuel‑theft claim
- Source = Sensors → choose the unit → Custom time covering the incident (≤ 6h) → Execute
- In Graph, add Fuel Level + Speed; look for sharp drops while stationary.
- Cross‑check exact timestamps & values in Table; export if needed.
C) Validate overspeed complaint
- Source = Parameters → select unit → relevant Custom range → Execute
- In Table, sort by Speed (desc) and review Max speed in summary.
- Use Graph to visualize peaks; check satellites/accuracy for GPS jumps.
Troubleshooting
- No rows returned
- Confirm time window and unit selection; ensure device actually transmitted.
- If querying multiple units, test each unit separately.
- Slow queries
- Reduce window length, limit to a single unit.
- Use Sensors or Parameters (not Both) when you only need one side.
 API Documentation