📖 Afaqy Knowledge Base / AVL / Monitoring
The Monitoring section offers a monitoring list and a map that works seamlessly to help you track and control real-time unit movements. This section provides essential features for effectively monitoring units and their parameters; however, the availability of certain features may vary based on your access rights.

- Homepage Button
- Navigation Sidebar
- Current Section
- User Apps
- Notifications Button
- Full-Screen Button
- Manage Account Button
- Sub-User(s) List
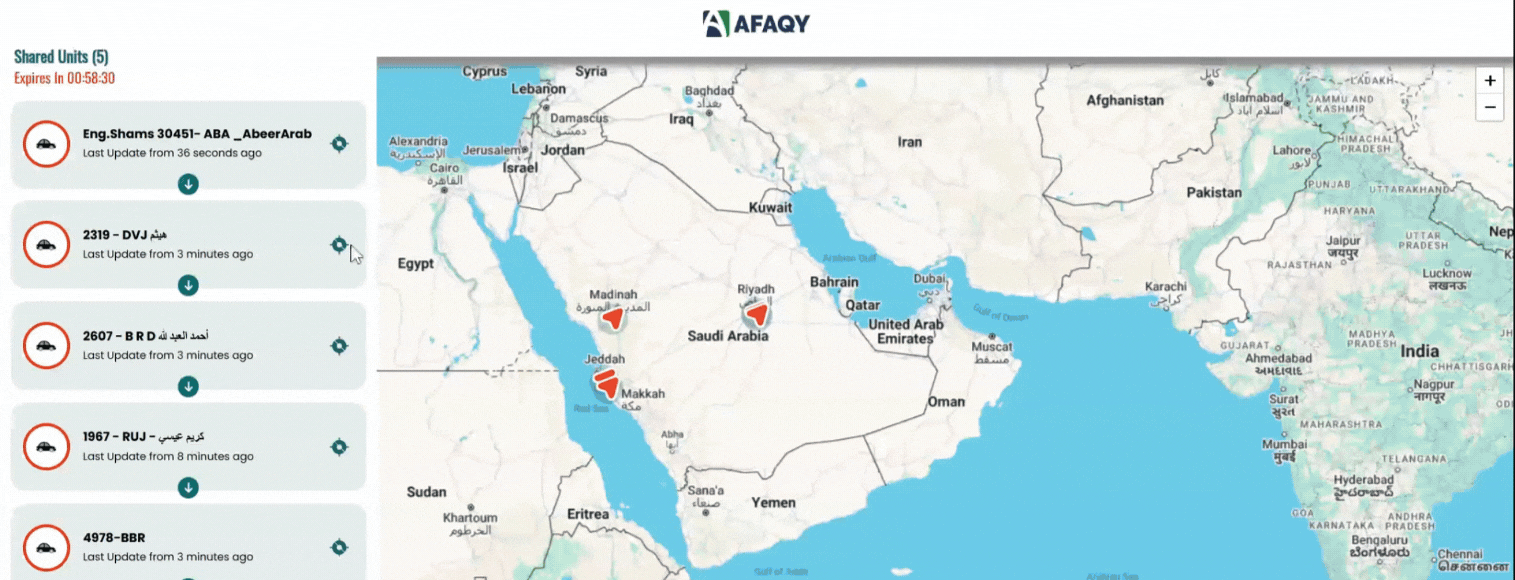
- Share Live Location
- Search Button
- Refresh Button
- Switch to Group View
- Add to The List
- Filter with CCTV
- Add All Available
- Customize Grid Columns
- Map View Button
- Monitoring / Total
- Stopping Units
- Moving Units
- Updates Button
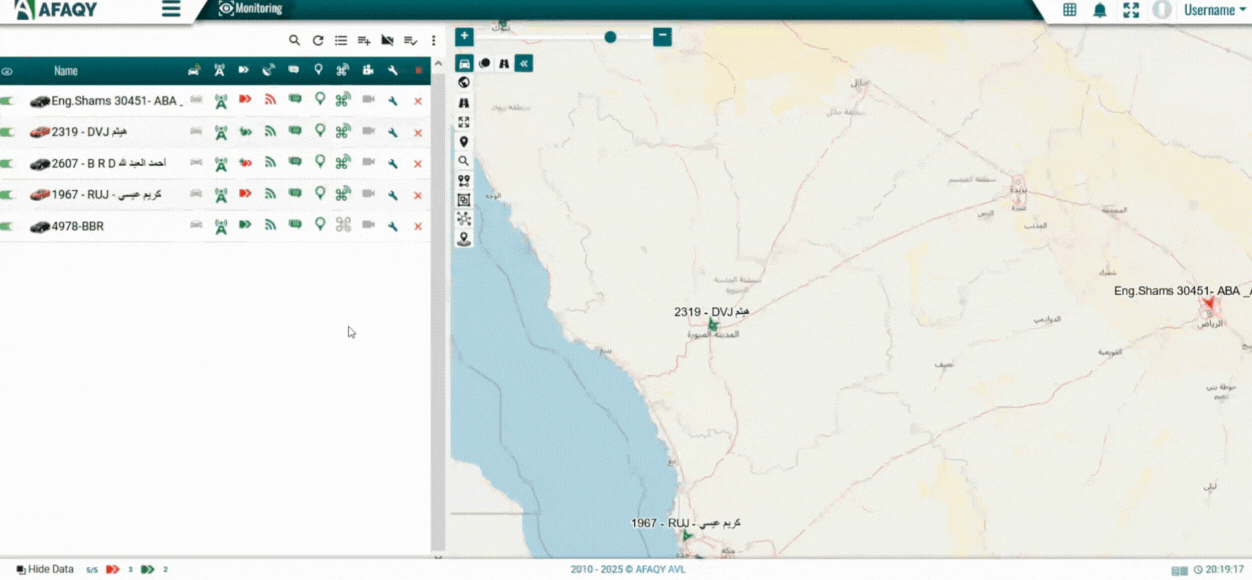
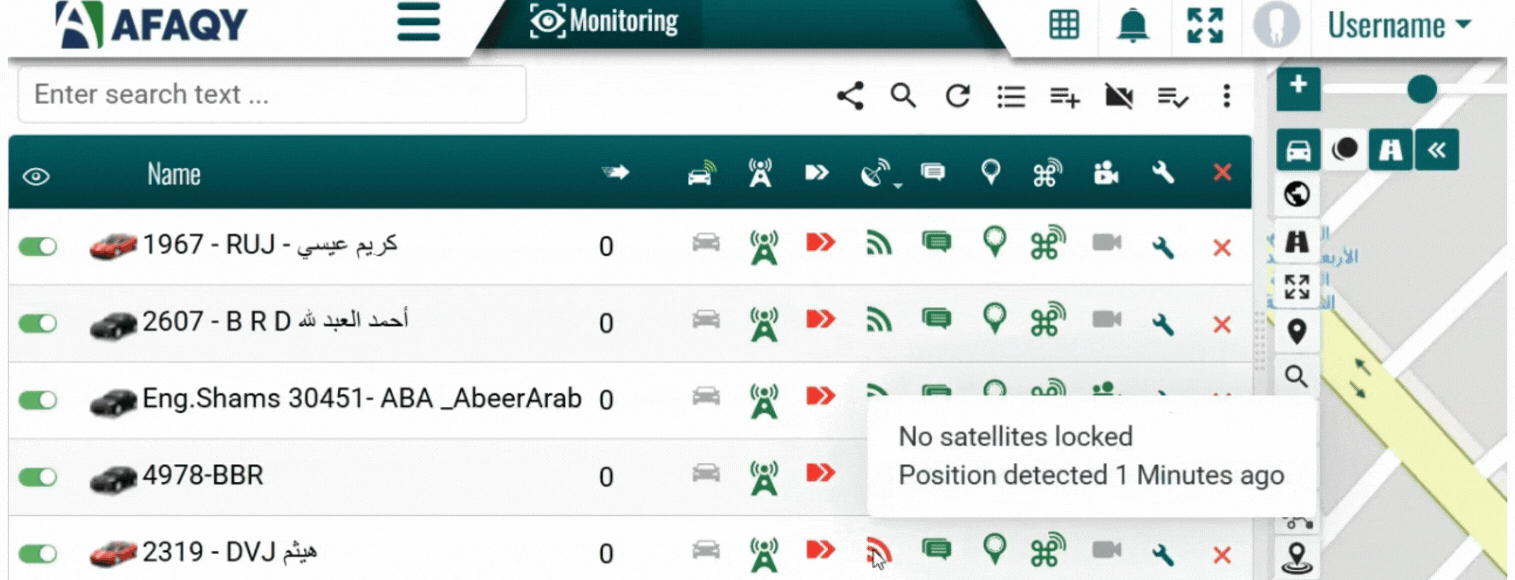
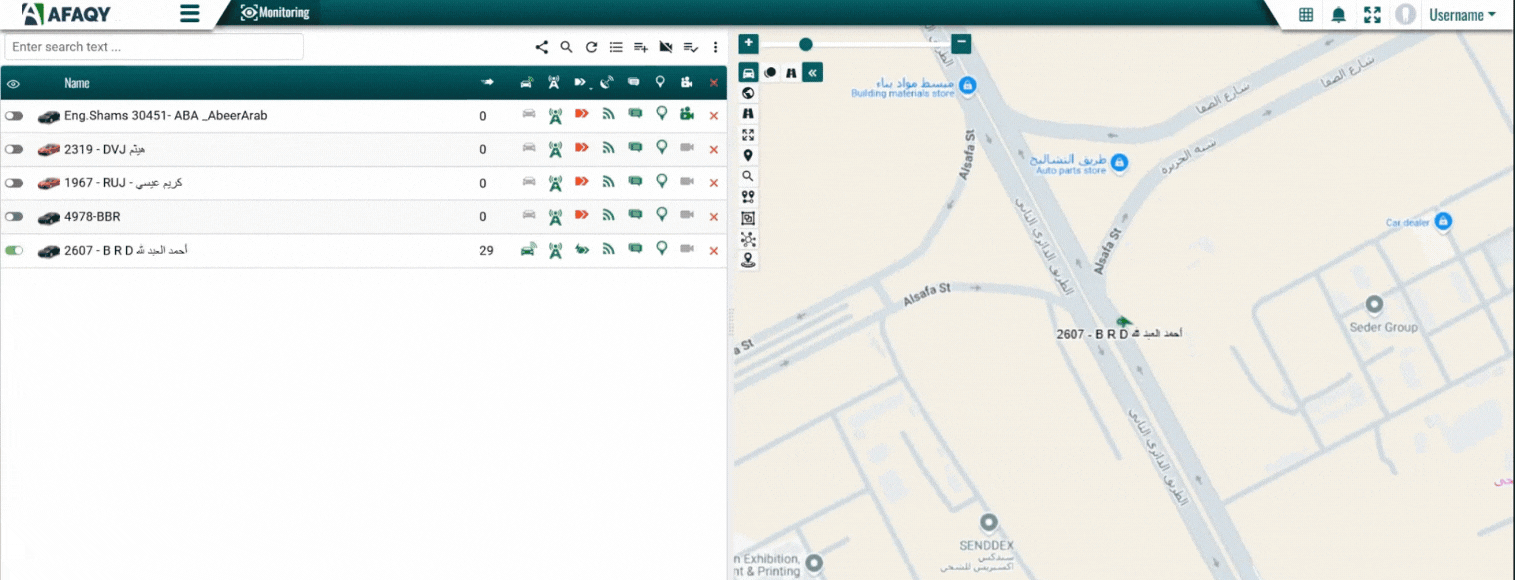
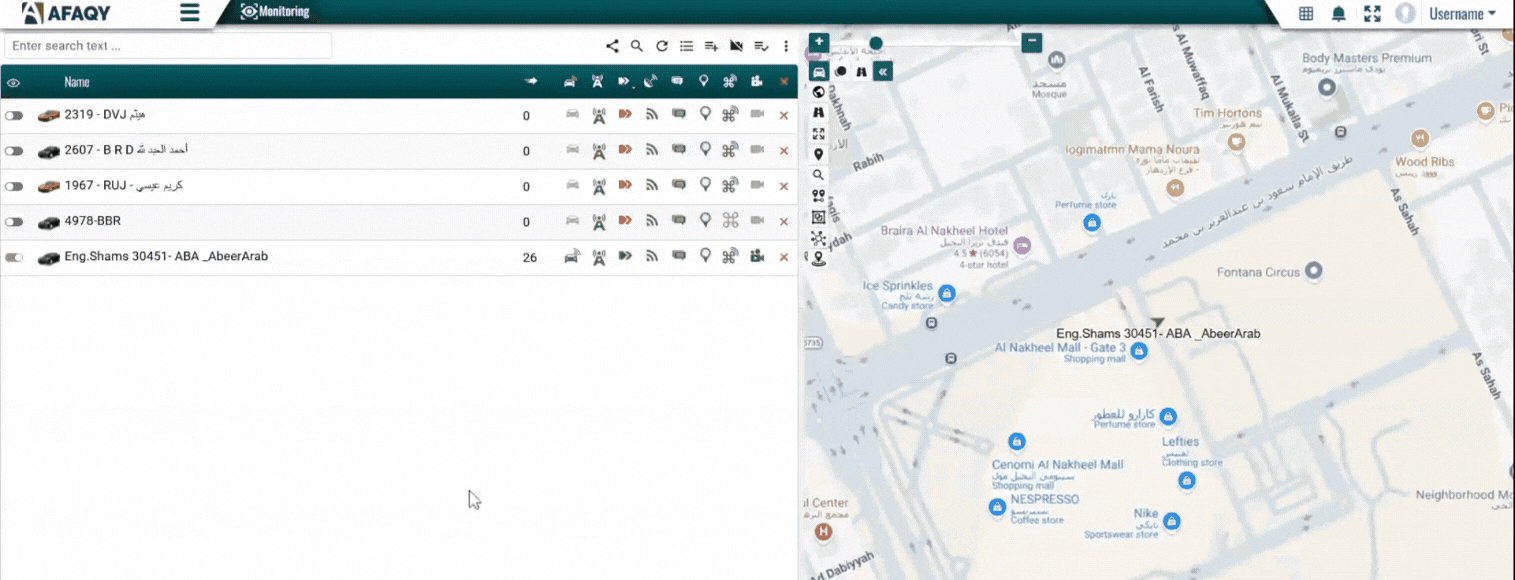
Monitoring List
The monitoring list provides detailed information about each unit along with a set of operational actions. You can access the following information by hovering over the unit's name:
/w=1920,quality=90,fit=scale-down)
- The time of the last received signal
- Location
- Speed
- Engine hours
- Odometer
- Incline from north
- Altitude (above sea level)
- Number of connected satellites
- Nearest geofence
- Nearest marker
- Time of signal recording on the tracking device
- Time of signal recording on the server

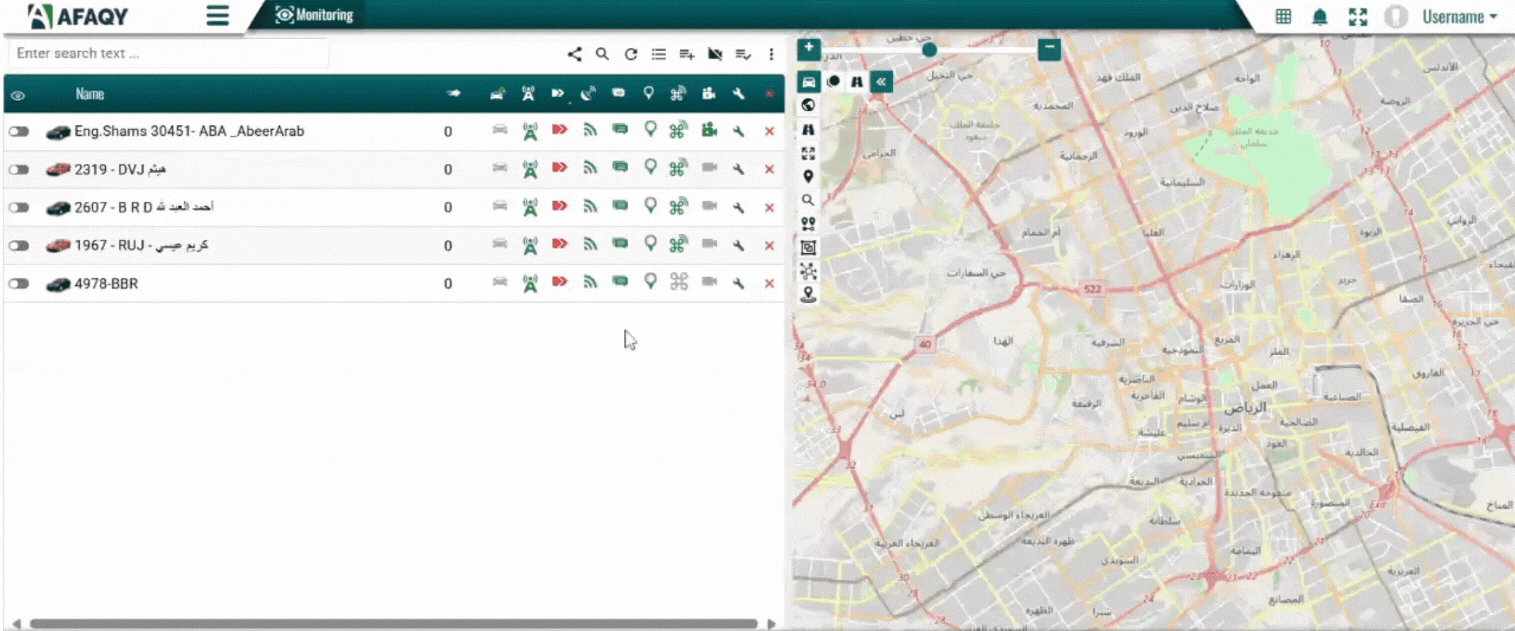
If a unit does not appear in the monitoring list, this indicates you do not have access to it. As a result, you won’t be able to send commands, request tracks, or perform most actions associated with that unit.
Monitoring Tools
The Monitoring section includes a set of tools designed to simplify the management of the monitoring list, providing a seamless monitoring experience. The names and functionalities of these tools are described below:


Monitoring Fields
By default, the monitoring list in the Monitoring section includes the following features: