📖 Afaqy Knowledge Base / AVL / Reports
The AVL Reports module is a powerful feature that enables users to monitor, analyze, and optimize fleet performance through dynamic and customized reporting. It provides comprehensive reporting capabilities across three main tabs: Reports, Templates, and Schedules. These tools help users analyze fleet data, automate reporting, and extract insights critical for operational decisions.

1
2
3
4
5
6
7 | Homepage Button
Navigation Sidebar
Current Section
User Apps
Notifications Button
Full-Screen Button
Manage Account Button | 8
9
10
11
12
13
14 | Sub-User(s) List
Reports Tab
Templates Tab Schedules Tab
Refresh Button
Add New
Expand/Collapse Button | 15
16
17
18
19
20
21 | Report Fields
Units Tab
Report Options
Monitoring / Total
Stopping Units
Moving Units Updates Button |
Reports Tab
This tab displays all executed reports. Users can:
- View the history of generated reports.
- Access the generated reports.
- Search for a specific report
.
- Refresh the report list to load new entries
.
- Expand /Collapse the reports list for easier navigation
.
Reports present data in structured tables, charts, and graphs, providing operational teams with clear insights for decision-making.

Next to each report, a set of action buttons allows users to:
Export report to Excel
Export report to PDF
Export report to HTML
Edit report
Delete report
Generating a report
Many report types allow filtering by:
- Unit name, driver, trailer, or sensor.
- Duration, distance, speed thresholds.
- Geofences or operational zones.
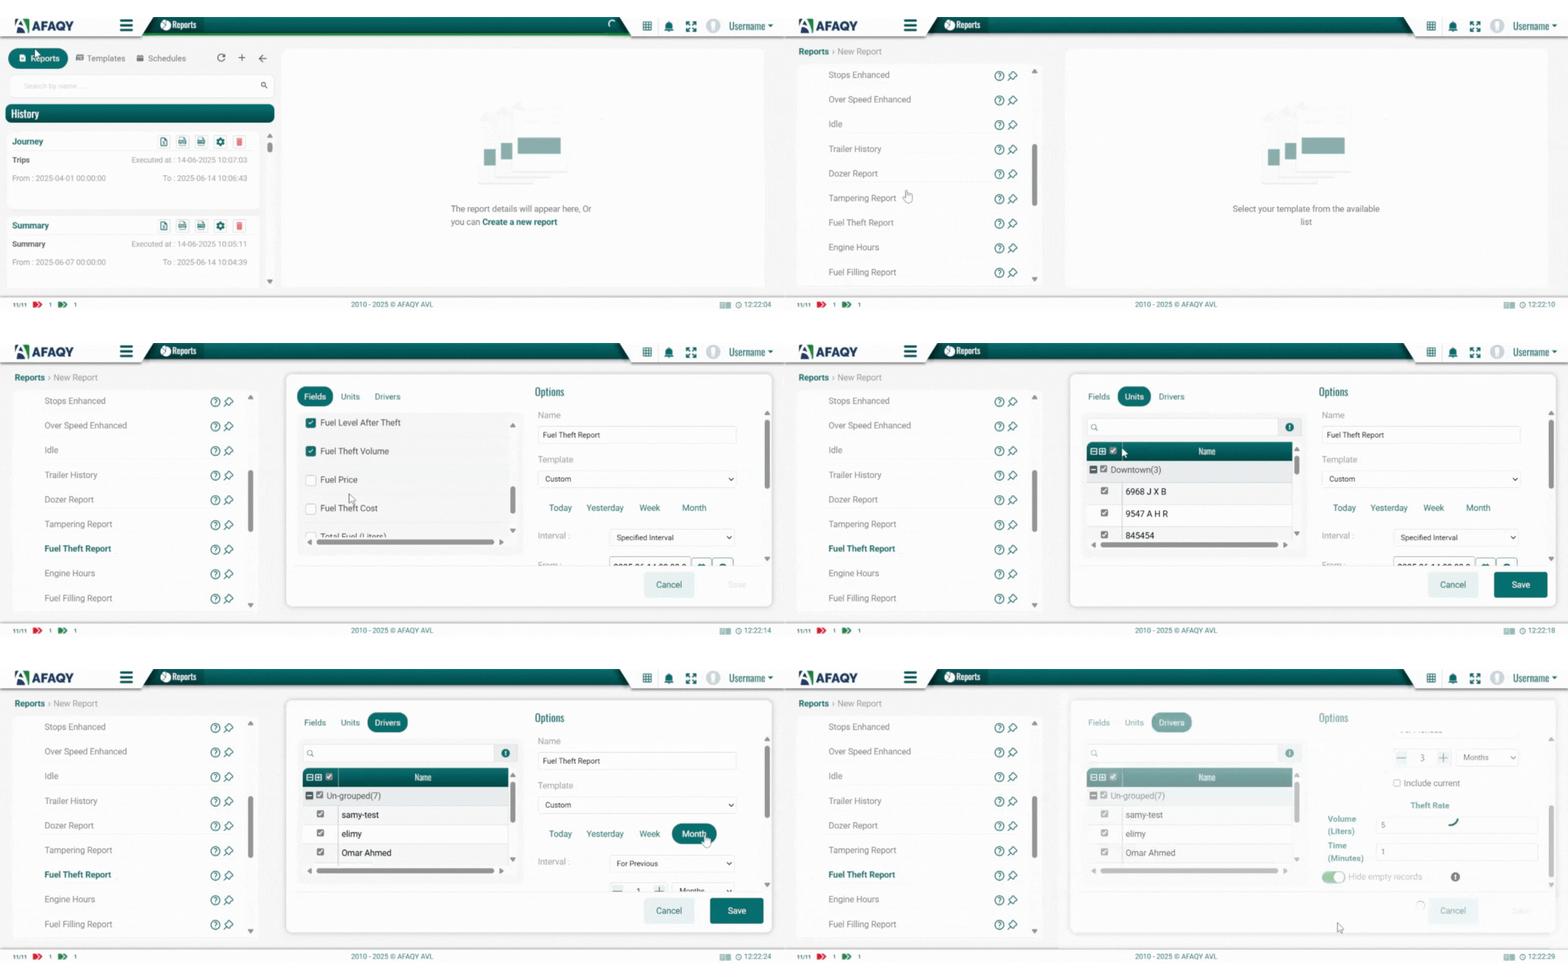
Follow these steps to create a new report:
- Click on the + icon or the “Create a new report” button.
- Select the relevant report category (e.g., Vehicle Activity, Zones Activity).
- Choose the desired report type (e.g., Trips, Geofences, Stops).
- Select this icon
to understand the report’s objective and its required input (optional).
- Pin the report for future use by clicking this icon
.
- Enter a name for the report.
- Choose a previously created template (optional).
- Specify the report’s duration.
- Define the report fields, units/drivers/geofences, filters, and any custom parameters.
- Click Save to generate the report.

Templates Tab
The Templates tab simplifies repeated reporting needs by allowing users to save report configurations for future use. This is ideal for reports that are frequently generated with the same parameters.
Features:
- Templates are grouped by report type for easy retrieval.
- Can include predefined units, geofences, drivers, and custom names.
- Editable and removable by users with permissions.
- Great for departmental, geofence-based, or unit-grouped reporting.

Report-templates can be edited  or deleted
Users can:
- Customize report-templates to suit their reporting needs.
- Search for a specific report-template
.
- Collapse/expand the report-templates list for easier navigation
.
Creating a report template
Each report template supports customized inputs, including:
- The report’s output fields.
- Units, Drivers, Geofences, and Sensors (depending on the report’s nature).
- Report timeframes and intervals.
- Value filters (e.g., speed, mileage, duration)
Follow these steps to create a new report-template:
- Navigate to the Templates tab.
- Select a report category and click + next to the report type.
- Configure the report fields, filters, and options.
- Click Save to store the report-template.
Schedules Tab
The Schedules tab allows users to automate the dispatch of reports to stakeholders via email. This ensures that decision-makers receive timely updates without manual effort.

Scheduled reports are displayed in a table with the following actions:
 Edit: Modify schedule settings.
Delete: Remove the schedule.
 Copy: Duplicate the schedule.
View: Preview the configured schedule details.
This feature is essential for automating compliance, operational reviews, and management reporting.
Scheduling a report
- Click the + icon to create a new schedule.
- Enter a name for the schedule (e.g., "Fleet Performance").
- Select an existing template from the dropdown menu.
- Choose the reporting period: Daily, Weekly, or Monthly.
- If Weekly, select the day of the week for dispatch (e.g., Tue).
- If Monthly, select the day of the Month for dispatch (e.g., 27).
- Set the send time (e.g., 9:00).
- Toggle additional options:
- Including Current: Include data from the current day/week/month.
- Only One Time: Send the report only once instead of recurring.
- Excel/PDF: Choose one or both formats for the report.
- Add recipient emails (separate multiple with Enter).
- Click Save to finalize.

Report Categories Breakdown
The reporting is organized into seven primary categories. Each category contains a set of reports tailored to specific operational metrics, offering both granular and high-level views of fleet performance.
For a detailed explanation of each report type, including:
- What each report measures.
- How the data is measured.
- Required input fields and data filters.
Please refer to the dedicated pages linked below:
- Summary Reports
- Vehicle Activity Reports
- Driving Quality Reports
- Zones Activity Reports
- Sensors Activity Reports
- Deprecated Reports
- Other Reports

